
Charting libraries for JavaScript abound, but a large number of teams still don’t get their charting libraries right in their production environments. This isn’t because people can’t code; the issue is that the comparison is flawed by design. Sure, all of them are good for making a line, bar, and pie chart; it turns out that when it comes to performance with load, GPU acceleration, and handling large datasets, things are far more complicated. A library that looks fine with 10,000 data points could choke with 100,000; one that looks fine in Chrome may be slow in Safari.
When it comes to charting libraries in the market, most comparisons are made with a “level playing field” where all the libraries being evaluated are compared to one another in equal measure, usually based on how many features they have. We didn’t do that. We evaluated the performance of real-time data rendering, the stability of GPU-acceleration, integration with different frameworks, and how mature the charting libraries are in terms of being used in a production dashboard. Here, the top 6 firms all shine in different ways and are best for different applications rather than simply claiming to be the best at everything. Here’s how they compare:
Top 6 JavaScript chart libraries
The six libraries below cover different sides of JavaScript charting rather than one universal ranking formula. Some are built for real-time rendering and large datasets, while others focus on chart variety, accessibility, framework support, or faster dashboard development.
This matters because the right choice depends on what the product actually needs: speed, flexibility, visual range, integration, or long-term reliability. A trading interface, a scientific monitoring tool, and a business dashboard will not judge charting performance by the same standard. The goal of this list is to show where each library is strongest and where teams should be careful before choosing it.
1. SciChart
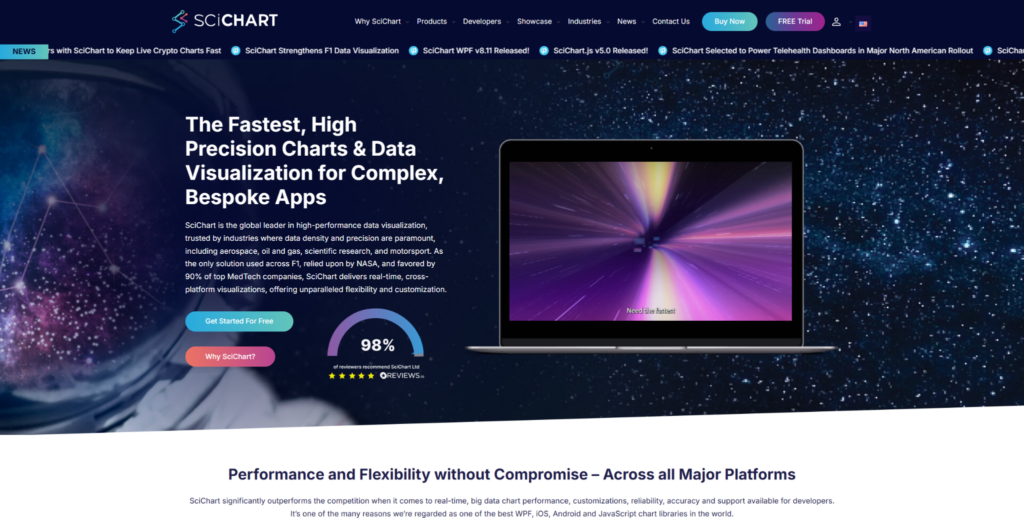
Established in 2012, SciChart has secured its footing as the industry-standard solution for aerospace and oil & gas sectors, specializing in visualization challenges that stump standard JavaScript charting libraries.
As a high-performance JavaScript chart library, SciChart uses GPU-accelerated rendering for real-time data, helping financial trading applications, scientific monitoring consoles, and large-scale industrial control panels stay responsive under heavy load.
While other frameworks might excel at producing an extensive variety of chart types, SciChart is the go-to option when the priority shifts from chart aesthetics to sheer speed, performance, and data volume.
SciChart works flawlessly on every platform, including WPF, iOS, Android, and web. With support for cross-platform charting engines, you only need to write your code once to deploy it on web, mobile, or desktop environments, ensuring consistency throughout the development process. SciChart is the framework of choice when developers are tasked with engineering applications requiring exact precision, custom visual rendering, or real-time updates for 100,000+ data points per second. The library is highly respected by engineers, as well as by anyone responsible for maintaining mission-critical dashboards.
What you need to know
- GPU-accelerated WebGL for real-time, Big Data visualizations;
- Cross-platform capabilities (web, mobile, desktop);
- Sub-millisecond refresh rates for real-time data updates;
- Precision and customizability, catering to scientific and financial chart types;
- Dedicated enterprise customer and developer support.
What could be improved
Pricing information requires a sales contact, as no public pricing tiers or information is provided for your review.
2. LightningChart Ltd
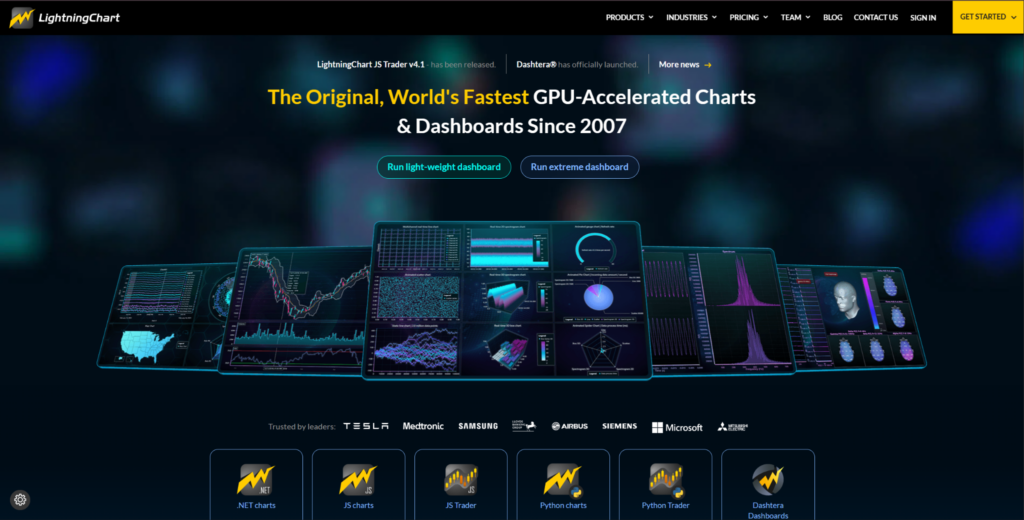
In 2007, LightningChart Ltd started to offer graphics charts accelerated by the graphics processing unit (GPU), even if other libraries had not yet noticed that canvas-based rendering was a limiting factor.
The library offers WebGL and DirectX rendering, ensuring cross-platform performance to the extent that the chart doesn’t drop frames when it has 10 million points, which is especially important for high-frequency trading, industrial real-time monitoring, and scientific applications. LightningChart supports JavaScript, Python, and .NET, enabling developers to have web charts, mobile apps, and desktop programs all running on a single library instead of on different libraries per platform.
It is possible to see the library in use at high-frequency trading, where charts don’t drop frames when they are processing datasets that are thousands of times larger than what libraries like Chart.js and Plotly are designed for, as the library can display real-time charts that have a large number of points at a frame rate of 60 frames per second.
In aerospace, where the charts need to handle massive datasets, the charts don’t drop frame rate while handling tens of millions of points, a fact that would not be considered negotiable by customers at a large corporation. Chart type coverage includes XY plots, 3D surface plots, polar charts, and parallel coordinates, which is a chart type that no other libraries offer.
Pros
- 2007 launch date, with the longest track record in the category
- Consistent WebGL/DirectX rendering
- Charts that don’t drop frames when displaying real-time datasets that are 1000x larger than other canvas-based libraries
Cons
- Pricing is only for large enterprises and is available on request
- No React/Vue documentation to compare to Highcharts’ Vue and React components
3. Highcharts
While GPU-accelerated alternatives sprint toward millisecond benchmarks, Highcharts concentrates on getting usable charts shipped. Highcharts supplies an extensive collection, including Core, Stock, Maps, Gantt, Grid, and Dashboards, meaning you’ll have the right library in your toolbox to visualize just about any scenario, from time-series financial charts to project timelines and geographic heatmaps. Rather than concentrating on raw performance, Highcharts champions charts designed for real-world production use; WCAG and screen-reader accessibility are included right out of the box with the Core library, rather than something you have to build later.
With modern framework integration (React, Vue, Angular), the company provides first-class components, rather than hacks, which matters a lot when you’re building dashboards that are supposed to feel like part of the rest of an enterprise SPA. The company provides support for both mobile and web platforms and provides responsive charts, with support for touch gestures and layout adaptation with respect to the size of the viewport. You can use this for interactive dashboards that don’t require the raw frame rates of GPU-accelerated charting but rather require accessibility, framework fit, and chart type diversity. It’ll be hard to beat the LightningChart for throughput on WebGL, with its million-point dataset support, but for interactive dashboards that need accessibility, framework integration, and a wide variety of charts, Highcharts has the advantage of providing a very mature, battle-tested library.
- Suite breadth: Core, Stock, Maps, Gantt, Grid, Dashboards in one package
- Framework-native: React, Vue, Angular components, with no wrapper friction
- Accessibility-first: WCAG compliance and screen-reader support built-in
- Mobile-optimized: Touch gestures and responsive layouts out of the box
- Weakness: Canvas rendering can’t match GPU-accelerated rivals on real-time datasets exceeding 100K points
4. Plotly
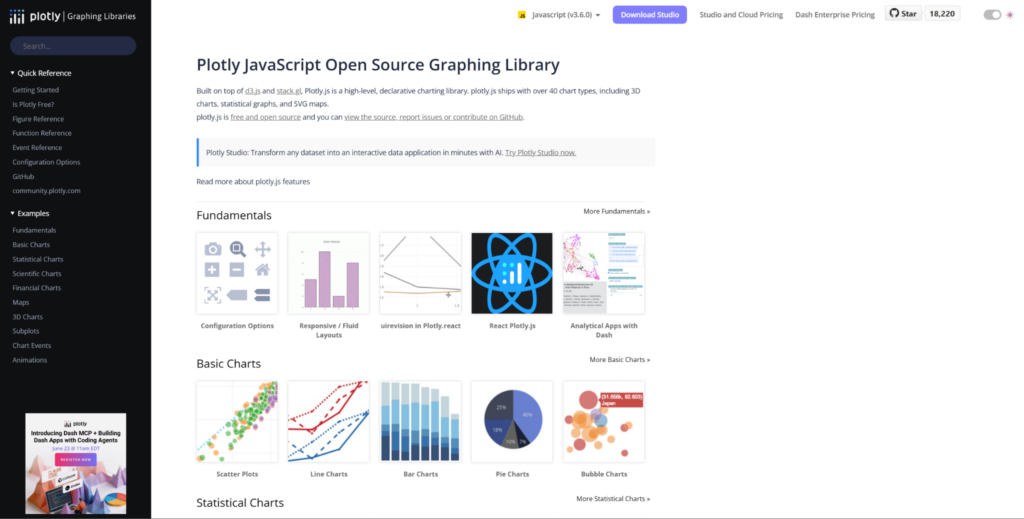
However, Plotly is an open-source graphing library with stability that has been proven in research, finance, and dashboarding. Unlike proprietary packages, it features a stable, free-to-use library built by a global community of developers. Its Dash library allows users to create full-blown data apps with no front-end experience. Simply put, data scientists can make production dashboards using either Python or R code. This means Plotly can evolve along with you.
Additionally, a new product called Plotly Studio was recently launched to offer agentic analytics; it makes it easier to interact with data and create visualizations. With Plotly’s cloud publishing, you can host in the cloud or within an organization. In short, you can experiment online, build your own deployment, or leverage managed hosting.
- One line weakness: Plotly doesn’t offer GPU acceleration or WebGL rendering and its speed lags behind the best-in-class real-time performance of SciChart and LightningChart when dealing with large data sets.
5. amCharts
Launched in 2006, over 20,000 companies trust amCharts more for the variety and quality of its charts rather than the speed of the rendering technology. Instead of providing real-time charting, which is the niche for SciChart and LightningChart, amCharts provides over 60 different types of charts, including financial charts and Gantt charts, giving you options that no other charting library can provide.
Its use of canvas means that you will get performance benefits over other pure SVG-based charting libraries, while not having to implement WebGL. In addition, its use of canvas means that amCharts charts can render on most common browsers, making it easy to build a chart for your dashboard. In addition, it supports WCAG-compliant accessibility right out of the box instead of adding them at a later date.
This is why amCharts makes for a great charting library for building your dashboard that has multiple types of charts, such as a financial dashboard with various types of charts. Because amCharts is a Canvas-based library, this is faster than pure SVG rendering libraries, but it still works in most common browsers. The accessibility options for this is built in. amCharts also includes interactive maps, so you don’t need to use a separate library for map charts. If you are building a chart with multiple types, amCharts is great, but this charting library isn’t for dashboards that need high-throughput data because you can use GPU and WebGL to render charts much faster.
- Has multiple types of charts, like financial charts, project management charts, map charts (60+), etc.
- Because this is a Canvas-based library, it is faster than other pure SVG libraries, but it works in most common browsers
- Accessibility features are built in, not added later
- No GPU/WebGL support; can’t handle large data sets in real time without latency issues
- No performance metrics for chart rendering; unclear if you can handle more than 100K data points
- The charting library is not designed for high-frequency data applications because of the lack of GPU acceleration and no data throughput benchmarking available
6. Fusioncharts
Fusioncharts provides 95+ chart types, plus 1400+ maps. In this roundup, that means we’re getting the widest chart support. Fusioncharts focuses on chart variety and easy integration with modern frameworks.
Fusioncharts provides out-of-the-box React, Angular, and Vue wrappers, so you can drop chart components into existing apps, avoiding the need to deal with Canvas or WebGL contexts. And Fusioncharts ships with 20+ dashboard examples, speeding up dashboard development. All visualizations are fully responsive and customizable, rendering correctly on both web and mobile browsers.
You’ll notice Fusioncharts won’t compete with LightningChart or SciChart’s speed on real-time data sets with over a million data points, but it’s worth noting Fusioncharts will still easily handle the tens of thousands of data points in your standard production data dashboards. For many dashboards, having a wide variety will outweigh having fast real-time rendering. Fusioncharts also offers a much wider range of chart styles, like geospatial maps, Gantt charts, and financial charts, which you can use all at once.
- 95+ chart types: financial, Gantt, funnel, and more
- 1400+ maps with drill-down
- No special wrappers: use with React, Angular, and Vue
- 20+ dashboard examples
Only canvas and DOM rendering: can’t match the performance of SciChart and LightningChart with real-time data sets over 100K points
Conclusion
So, what is the best JavaScript chart library? It really depends on if you prioritize raw speed for real-time data, a wide variety of chart types, or integration with specific JavaScript frameworks, as this article will reveal which chart library has the edge in each area.
Above, we listed the six chart libraries we rank and explained the main pros and cons of each one, but here’s what you need to know: Libraries with high GPU-accelerated engines perform the best when handling high-speed real-time data streams, while chart libraries with many chart types and a wide accessibility focus are better suited for chart libraries to build comprehensive dashboards.
When choosing a chart library for your use case, first analyze your data needs to understand whether you will be working with smaller datasets or large data sets, and if your charts will need to update in real-time. Then, select the top two libraries that are a good fit for the type of data you work with as well as your preferred development framework, and try out both of these chart libraries to see if the performance meets your expectations.